Before we start this project we have to find a topic to do a graph about. When I find my topic I look information for my graph. I take information in https://en.wikipedia.org/wiki/List_of_most_viewed_YouTube_videos in that web site and put them in google sheets...
I put these information to "Desmos" to make point.
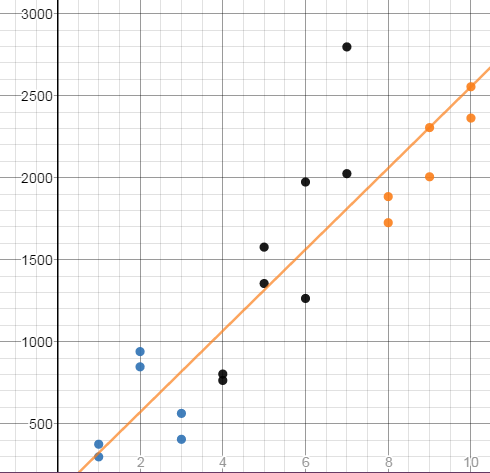
I make three group and I found a best fit line on each group but before that I calculate to find the best fit.
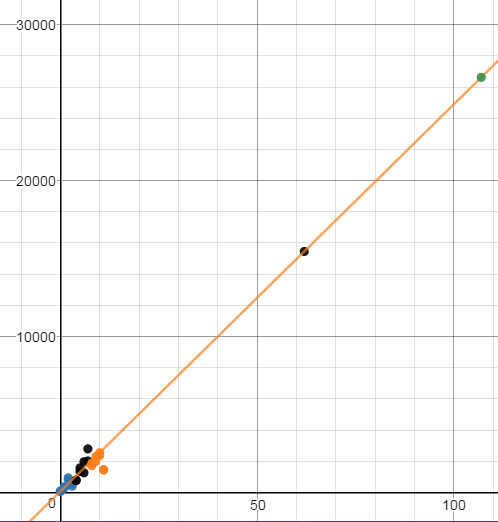
Then I calculate the total best fit.
After that I found the point on 2067 and 2112.
Thank you for your all listening