Overview
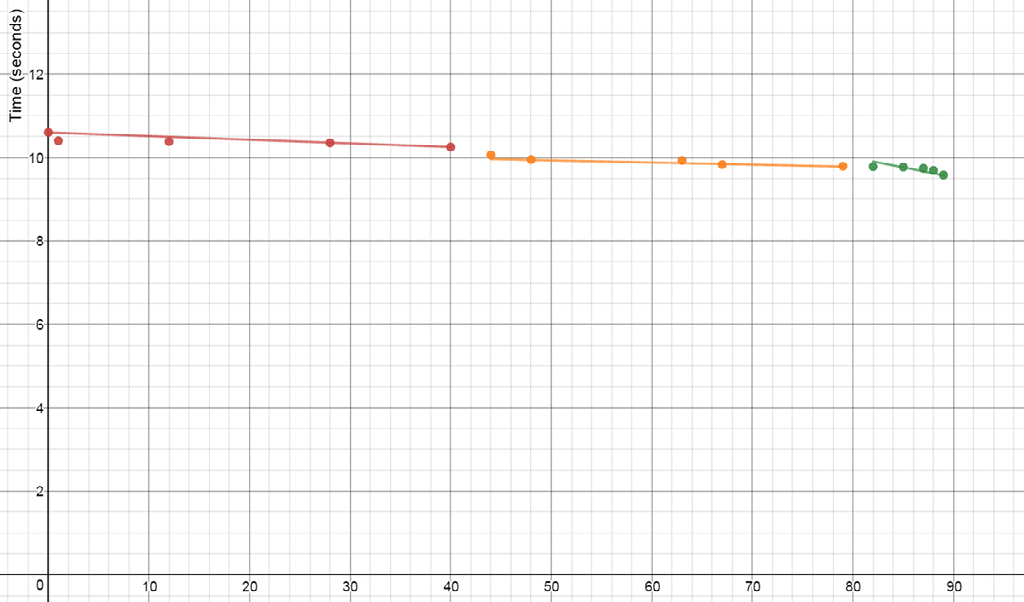
We were asked to create a graph showing the growth of a subject over time. We had to choose a subject, find at least 15 data points that show some kind of change over time, and put it into a table on Desmos. Then, we needed to split the data points into 3 equal intervals and find a line of best fit for each of them. Finally, we needed to find a line of best fit for the entire set of data and predict what the values will be 50 years and 95 years from now, while making notes of any trends or outliers we find along the way.
Data
The Future
When the data is observed, we can see that the times are getting more and more difficult to beat. It's also clear that the graph isn't completely accurate. According to the overall line of best fit, in 3037, the world record time to sprint 100 meters will be 0 seconds, which, of course, is impossible. If I were to predict a time run in the future that couldn't be beaten, I would choose 8.5 seconds. However, to make a more accurate prediction on an unbeatable time, an overall curve of best fit would need to be solved.
The End
Thanks for listening! :)