In this project I had to make and record the data for Belgium's Population and how it increased and decreased in the past 15 years. What you will see next is pictures of my calculations.
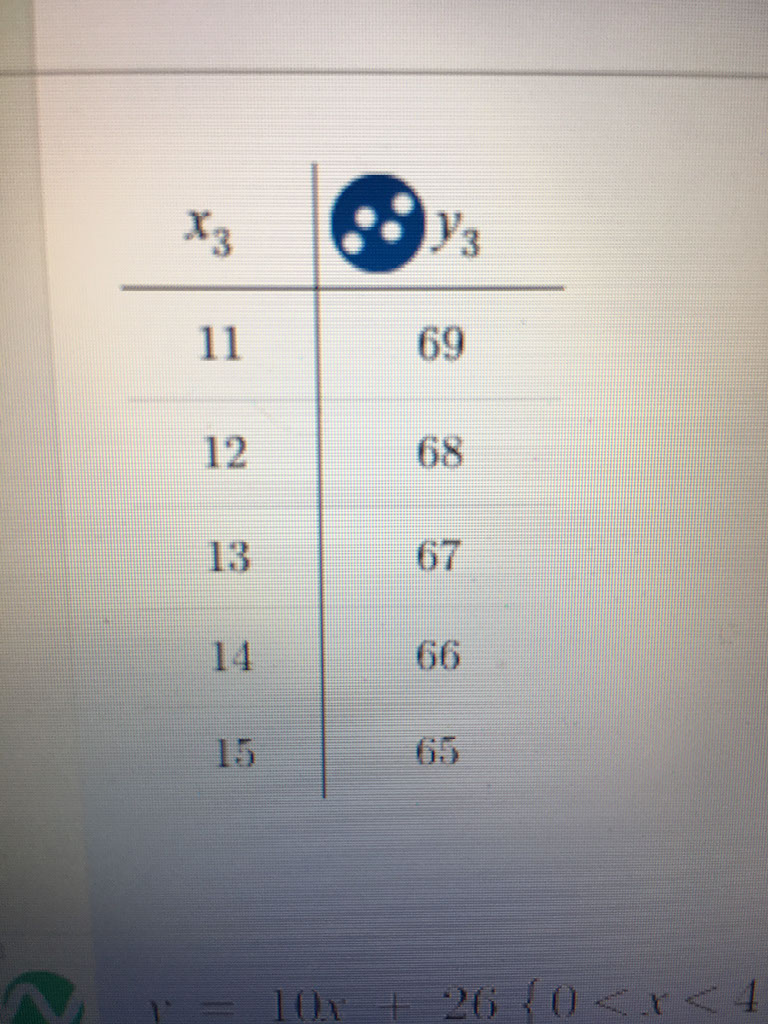
These were my calculations for the three intervals. Next, you will see my graph with all data points .
For m graph it is hard to say where it will be in 50 and 95 years. My graph predicted a negative growth rate of -1280 in 50 years and a negative growth rate of -4425 in 95 years, Now I do not agree with this forecast because the population of Belgium is more likely to stay more stable. I will have more confidence of the prediction of my graph with short-term forecast within no more than 5 years.