The Population Change Equation
Important Definitions
- Crude Birth Rate (CBR): Number of births per 1000 people in a country
- Crude Death Rate (CDR): Number of deaths per 1000 people in a country
- Rate of Natural Increase (r) or Biotic Potential = Crude Birth Rate - Crude Death Rate
- Zero Population Growth (ZPG) : Occurs when the CBR = CDR
- Total Fertility Rate (TFR): An estimate of the total number of children a woman will have during her reproductive years in a country. This is the most useful measure of fertility when predicting future population change.
- Replacement Level Fertility: How many children will it take to replace the parents in this country based on infant mortality rates. Developed countries usually around 2.1 or less, Developing countries usually around 2.5
Let's Do Some APES Math
Doubling Time and the Rule of 70
Doubling Time is the number of years it takes for a population to double its size. The number 70 represents the slope of an exponential growth curve and can be used to determine doubling time.
Take the number 70 and divide by the % growth rate for the population you are studying. For example, if the Growth rate is 2%, you would say 70 / 2% = 35 years. So in 35 years that population will double in size. Use the whole number for 2%, not 0.02 when dividing.
Growth Rate
How quickly a population is growing or shrinking
- GR= (Final-Initial) / Initial X 100 for animal/plant populations
- GR= (CBR-CDR) / 10 for determining country or world growth rates
- GR= (CBR + Immigration) - (CDR + Emmigration) / 10 for determining the growth rate of a single nation or region.
Example: Deer population in 1985 = 1000, and the Deer population in 1995 = 1022. 1022-1000/1000 X 100 = 2.2% Growth Rate
How long for the Deer population to double? 70 / 2.2% = 31.8 years
Your Turn:
Worldwide, there were 20 births and 8 deaths per 1,000 in 2009. Calculate the growth rate and the doubling time based on 2009. See me during tutorials for help!
Human Population Demography
Population Age Structures
The majority of people on Earth at this time are less than 15 years old.
- 0-14 years of age considered Pre-reproductive years
- 15-44 years of age considered Reproductive years
- 45 + years of age considered Post-Reproductive years
High Income, Highly Developed, Industrialized Countries
- US, western Europe, Japan, Australia, New Zealand, and Canada
- 20% of the world’s population, but control 80% of the world’s wealth
Age Distribution Histogram for developed nations (Population Pyramid)
Baby Boomer Influence on U.S. Population
Low Income, Developing Countries
- Eastern and central Africa, India, and central Asia
- 80% of the world’s population, but control only 20% of the world’s wealth
Age Distribution Histogram for developing countries (Population Pyramid)
The World Versus the U.S
World Population: 7, 352,645,000 8:24am 11/16/2016
- 4.3 Births per second
- 1.8 Deaths per second
- Net gain of 2.4 people per second
U.S. Population: 324,934,790 8:25am 11/16/2016
- One birth every 8 seconds
- One death every 12 seconds
- One international migrant (net) every 28 seconds
- Net gain of 1 person every 13 seconds
Factors Increasing Birth and Fertility Rates
- Kids working to provide for family in developing countries
- High infant mortality rates
- Less than 25 years old with first child
- Religious or Cultural Traditions
Factors Decreasing Birth and Fertility Rates
- Urbanization
- Cost of raising children too high
- Opportunities for women with employment/education
- Availability of Birth Control
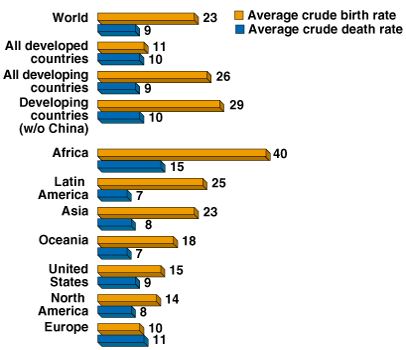
Crude Birth and Death Rates (from 1998)
How have things changed in the past 18 years?
Demographic Transition
A description of the correlation between economic development and decreased fertility rates. The more industrialized a country gets, the closer to Zero Population Growth they become.
- Pre-industrial stage: Country has little to no industrialization so Birth and Death rates are similar but high.
- Transitional stage: Country begins to industrialize. Birth rates stay high, but Death rates drop with increased sanitation and health. Largest Population growth occurs during this stage.
- Industrialized stage: Country is fully industrialized, but still young. Birth rates drop towards lower death rates.
- Post-industrial stage: Country is fully industrialized, with older generations living longer with high quality of life. Birth rates fall to and below Zero Population Growth.
- On occasion, there is a fifth stage that is shown called the Declining stage. This is where population begins to decline due to birth rates falling below death rates.
Population Solutions
Reduction of Poverty
- Life Expectancy: Developing countries have raised the average life expectancy from 48 to 65 years of age globally, but there are still several countries with a life expectancy in the mid 40 years range.
- Infant Mortality Rate: approximately 22,000 infants a day worldwide due to undernourishment, malnourishment, and infectious disease.
Empowerment of Women
Must provide increased opportunities for education, health care, work, and equal rights including pay. This will allow for fewer children to be born, and for better care to be provided for those children.
The U.S. has the highest teen pregnancy rate in the industrialized world. We also have higher drug addictions and inadequate healthcare for mom and baby compared to other developed countries.
Family Planning Policies
- Nearly 42% of pregnancies are not planned.
- Educational and clinical services are vital.
India's Family Planning Policy
- India started the first national family planning policy in 1952.
- The program has largely been a failure because of poor planning, inefficiency, low status of women, extreme poverty, & lack of funds
- Couples still have an average of 2.45 children per woman because of the belief that they need children to work & care for them in old age.
- India's population is still expected to overtake China before the middle of this century.
- India’s people are among the poorest in the world, with an average per capita income of $1627 a year, which contributes to widespread malnutrition.
China's One Child Policy
China's One-Child Policy became a Two-Child Policy in 2015. The One-Child Policy was enacted between 1978 and 1980. The following links and videos will give you some more info on this infamous policy.
- Since 1970, China, with the world's largest population, has initiated efforts to better feed its people & control population growth.
- Strict population control measures through the ONE CHILD POLICY prevented couples from having more than one child.
- The One Child Policy was largely successful at reducing population growth, even though it was highly coercive and sometimes brutally enforced.
- Under the One Child Policy, Couples who pledge to have no more than one child are given extra food, larger pensions, better housing, free medical care, and salary bonuses; their children will be given free school tuition and preferential treatment in employment. Couples who break their pledge lose all the benefits.
- All married couples have ready access to free sterilization, contraceptives, and abortion. Having localized family planning centers with easy access is a positive aspect of China's policy that we could copy in the U.S.